|
As James Pembroke and I say in Dataproof Your School (2022, p4), the extensive body of research into teaching, learning and schooling suggests that students need to be in school, in class, focused and learning what we want them to. Here, we will focus on the first two areas: are students in school and in class? What do we know about the trends over time? What do we know about the current situation? What are the best bets to ensure that students are in school and in class? What should schools do to address missed learning? It is important to note that students’ attendance is record twice each school day (morning and afternoon) and that these are referred to as ‘sessions’ of attendance. So with 190 school days per year, there are 380 potential sessions a student should attend. Trends over time  In England, the Department for Education and its predecessors have been collating data on pupil attendance and reasons for absence since the early 2000s. Student absence is grouped into authorised and unauthorised absence.  Whilst some details have changed since the Covid shock of 2020, we know the following. Overall attendance dropped from 6.5% in 2006/7 to around 4.6% in 2013-19. It rose to 7.6% in 2021/22. Pre-pandemic, authorised absence had stabilised at around 3.8%; this category of absence is mostly due to student illness (around 3%). Authorised absence was decreasing over time, from 5.5% in 2006/7 to 3.3% in 2018/19, which is likely to have been due to schools increased focus on maximising school attendance. Unauthorised absence was increasing over time as schools were encouraged to disallow absence and decreased the likelihood that they would authorise non-attendance at school. As per the table above, unauthorised absence is defined as students being late and arriving after registers have closed (code U), being absent due to family holiday (G) or absent for any other reason (O, often referred to as Absent Unauthorised Other, or AUO) not covered by the first two categories of unauthorised absence. Unauthorised absence is mostly due to AUO.  Pre-pandemic, late arrivals to class accounted consistently for less than 0.1% of all unauthorised absences, rising slightly to 0.11% in 2022/23. As authorised absences decreased into the 2010s, unauthorised absence rose as previously shown. The increase in unauthorised absence is largely due to more absence being marked Absent Unauthorised Other, with some increase due to schools being required to refuse to authorise family holidays in term time. It is clear from these data that most students are in school most of the time: over 50% of students have less than 5% absence. Some students are absent more than 10% of the time. This group is labelled Persistently Absent. This had settled at around 10% of pupils in 2015-19 but has risen to around 20% (the level in 2006/9) since the pandemic, mostly driven by more secondary pupils being flagged as persistently absent. Illness is a major component of persistent absence with 7.8% of all pupils missing 10% or more sessions due to illness alone. Some students are absent more than 50% of the time. This group is labelled Severely Absent. 2.0% of pupil enrolments were severely absent in Autumn 2023/24 Absence looks different in Primary Schools and Secondary Schools, and both are different to Special Schools.  The government has introduced various measures to tackle absence. Families can face penalties for keeping children away from school; a fine of £60 per child (due to rise to £80 per child from August 2024, potentially rising to £160 per child for further long absences within three years) can be approved by school and issued by a local authority for a period of unauthorised absence. Local authorities can also seek Education Supervision Orders or prosecutions if they deem fit. Prior to August 2024, local authorities varied in their approach to issuing fines (see for example these two different approaches: Middlesborough and Dorset). From August 2024, schools are required to consider triggering fines if a pupil misses 10 or more sessions within any 10-week period, with a new National framework for penalty notices which includes the following:  Analysis suggest that prior to August 2024, this would have meant that ‘around 1 in every 5 pupils is at risk of falling below the proposed new absence threshold. This risk is higher for pupils in secondary schools than those in primary. Disadvantaged pupils and those with special educational needs are at greater risk than other pupils.’ The Department for Education also collects and publishes data regularly to encourage schools to focus on issues regarding absence – daily sharing of attendance data is mandatory from August 2024. The education of the minority of students who miss large amounts of schooling is negatively impacted by their time away from learning; there is a clear link between absence and attainment and this link is consistent over time.   The Covid pandemic has had an impact on absence; there is clear evidence that more absence is due to illness than pre-pandemic. There also suggestions that some students and families are less inclined to view absence negatively than previously. Absence is an issue across the world, with reports in the USA suggesting parents and students are "less conscientious about schooling and more conscientious about health". In summary, schools need to reduce unauthorised absence as much as possible, as they have done in the past to ensure that students are in school and in class. What does the research say? Most of the focus is on preventing future absence rather than action to address missed learning. The Education Endowment Foundation has a section on Supporting school attendance:
The EEF notes that much of the existing evidence is from the USA and from settings which are not particularly similar to England. Much of the evidence was undertaken pre-Covid. The majority of studies involve secondary school students rather than those in primary. The EEF includes some useful guidance in its ‘Working with parents to Support children’s learning’ advice. This includes advice about creating open channels of communication with parents, which can be particularly useful for those families with students at risk of future higher-than-typical absence. There is almost no research into successful strategies to address missed learning due to absence. This seems odd, given schools’ increasing ability to track absence with more precision over time. Additionally, very few schools support teachers in their tracking of missed lessons due to absence, and missed learning is not routinely recorded within a school’s databases. Given that the majority of absence is due to illness – and national attendance patterns suggest students miss around 3% of learning time through illness - this in an area which may worth exploring in future. Official Guidance The Department for Education issued guidance for schools in 2022 (which has been updated for 2024) called Working together to improve school attendance. This has been updated to take account of new legislation which schools have to follow from August 2024. The guidance has three pages with the following headings in a 67-page document:  This doesn’t say anything particularly useful about tackling issues related to attendance, other than making it clear that attending school and keeping accurate attendance and absence data is important. Whilst the document recommends analysing data, it does so to identify students and families who should be supported to avoid absence in future.
What do schools actually do to address attendance issues? Ways to reduce future attendance issues may include:
In conclusion Students need to be in school and in class. Most students have high attendance but a significant number do not. Any lessons missed will have an impact on a student’s education. Most schools track attendance and aim to reduce future absences. There is an opportunity to make better use of data to understand patterns of absence, to help teachers to track lessons and learning missed and to make changes to allow pupils who miss learning opportunities in school to catch up key learning they may have missed.
0 Comments
 A Little Guide for Teachers to Using Student Data - published on 25th June 2024 - is squarely aimed at those in the classroom and it’s packed full of hints and tips for busy teachers.
Teachers gather data on students from the moment they enter the classroom. The Little Guide for Teachers to Using Student Data will help maximise that data and to know which other information to have at your fingertips. Buy it direct from Sage or from a bookshop near you. Schools in England have, as James Pembroke and I explain in Dataproof Your School, a licence to change the way they think about student data. As we say in the book, “Schools can and must adapt assessment and data systems to ensure they are focused on supporting pupils.” So how should schools go about making changes to achieve this aim? Think about what you want to know The first step is to consider what information you actually want to know about the educational experience of the students in your school. We have good evidence from the Educational Endowment Foundation about the areas on which schools should focus their efforts to support their students. Their report, The Guide to the Pupil Premium*, identifies the follow three areas:
The following graphic, available on the EEF website distils the report’s recommendations:  Additional evidence from the Great Teaching Toolkit’s Evidence Review suggest that effective teaching can be summarised as
From this, it is clear that ensuring that students are working hard to learn – that they are focused on learning what we want them to – is key. In Dataproof Your School, we summarise this research by saying that schools should focus their efforts on ensuring that students are in school, in class, focused and learning. Your data should help you keep track of this over time so that you can create useful summaries for students who need support in any of these areas. *Whilst the EEF focus on students in receipt of Pupil Premium funding, there is good reason to think that focusing on these areas will support all students in school. What information do you need to gather and collate? We split the information you need to capture and store into four different areas. These are:
Identifying which data you will gather and collate is key to minimising the time and effort required to take control of your student data. Once this student data is specified, you can begin to reduce the amount of time it takes to get information from the classroom to your student database by standardising systems and supporting staff as you minimise the effort required to get student data to where it needs to be. A key consideration when specifying which data to gather and collate to support your work with students is to futureproof your data as much as possible. The longer you are able to collect particular categories of student data, the more you will build up a picture of your students, your classes, your cohorts and of your school. How might you deal with misconceptions about student data? Teachers are well versed in dealing with misconceptions which their students may have. Once again, the EEF has good summaries and guidance on the subject. You should also consider what misconceptions regarding student data your staff might have. Many school staff – particularly those who came into the profession a few years ago, when the data landscape looked very different – may not have had much professional development in understanding the benefits and limitations of assessment data, for example. Many teachers have not had much training in the theory behind formal assessment – and standardised assessment in general – and therefore may not understand the thinking which underpins the inferences which can be made from results of this type of assessment. In many schools, readily available data is often underutilised when it comes to understanding students; age within cohort, for example, is known to have a clear affect at population level, and assessment data from earlier phases of schooling may not be used as effectively as they might be. Schools now collect extensive data on children in the Foundation Stage, for example, which may not be well understood by those teaching classes of older students. Results from the Phonics Screening Check are often overlooked at later points in a student’s journey through school, even though this data can often be extremely useful in understanding potential misconceptions or difficulties students might face. Data on medical or attendance issues, additional support a student has received, or disruption caused by staff illness or absence – which may provide teachers in subsequent school years valuable insight into potential gaps in curriculum knowledge - is often lacking at later points in students’ careers. Creating time and space for development in Data Literacy – understanding these kinds of issues relating to student data – may be a key area for development in your school. How are you going to make the changes you need? Yet another useful resource here is the EEF’s A School’s Guide to implementation. It uses ideas which will be familiar to teachers to help schools to use a version of the “assess, plan, do and review” cycle to ensure that any changes which you make are likely to have a lasting impact.  In order to ensure that any changes you make are effective, you need to engage your staff and key stakeholders, to ensure that what you are intending to change is well understood and to reflect and adapt as necessary.
Once you are ready to implement change, you need to ensure that the change is evidence-informed, that it is the right change to make and is feasible in the time you allocate to making changes. You then need to ensure that you put effective systems and structure in place to enable the change to happen. Finally, you need the right people in the team which will steer the change through to implementation. All of this has to be supported by the “explore; prepare; deliver; sustain” cycle, which ensures that you move forward with purpose, making gradual improvements, checking and adapting as you proceed. Richard Selfridge is an Education Data Consultant who has supported schools and MATs across the country to develop of their use of student data. He began working with Insight Tracking in April 2024 having worked with Jamie Pembroke, Insight’s Director of Strategy, on many projects in the last ten years. We have news of two new podcasts released this month. The first is the Thinking Deeply about Primary Education podcast which features Richard Selfridge and James Pembroke discussing all things assessment with host Kieran Mackle. It's a long listen packed with help and advice and we hope that you find it useful. We've had a lot of good feedback already, as you can see below:   The second podcast is the return of the Databusters for the 2022-23 academic year, as we discuss the current picture for Statutory Assessment as well as looking at discussions around assessing the wider curriculum.  In other news, Richard Selfridge has authored an online 'Using Data Effectively to Support Pupil Development' course for TES which is available now. Part of a series of online leadership courses aimed at aspiring, middle and senior leaders, the course is suitable for both primary and secondary schools and further details are available here.  Our book Dataproof Your School was published in January this year and is a comprehensive how-to guide to school data. As ever, if you would like expert support with all things assessment and school data, please don't hesitate to get in touch.
With the new academic year upon us, I delivered a session entitled ‘How and Why to Dataproof Your School’ at ResearchEd’s National Conference in London on 3th September. My talk summarised the key message from Dataproof Your School: Take control of your data, maximise effectiveness and minimise workload.  Having worked with MATs, primaries and secondary schools on develop strategic use of data, I am pleased to see that my work with Driver Youth Trust - most recently writing DYT’s Literacy Difficulties Framework based on the work we have done with schools over the last ten years - ties neatly into a clear summary of the effective use of data in school: Build pictures to identify where changes need to be made and make those changes effectively.  My work with schools on data and SEND is underpinned by the EEF’s excellent ‘Putting Evidence to Work – A School’s Guide to Implementation’ guidance. Making changes which are sustained over the long term is complex but eminently possible with expert guidance and support. As an independent advisor with wide ranging experience working with schools in a variety of contexts, I am always open to helping schools who are looking for strategic support to effect change. If that sounds like you or someone you know, please do get in touch. In the meantime, the Databusters Podcast marches on and we are looking forward to welcoming a series of guests onto the podcast over the course of the coming year. In addition, the Databusters will be out on tour so if you’d like to host us or to attend one of our events, please do get in touch. Finally, Sage Publishing are offering 30% off both Databusting for Schools and Dataproof Your School with the code RESED30 at www.sagepub.co.uk until 1 October 2022:  We’re pleased to announce that Dataproof Your School was published in February and has been generating a great deal of positive comment. As well as lots of Twitter feedback, the Amazon ratings are looking good too… 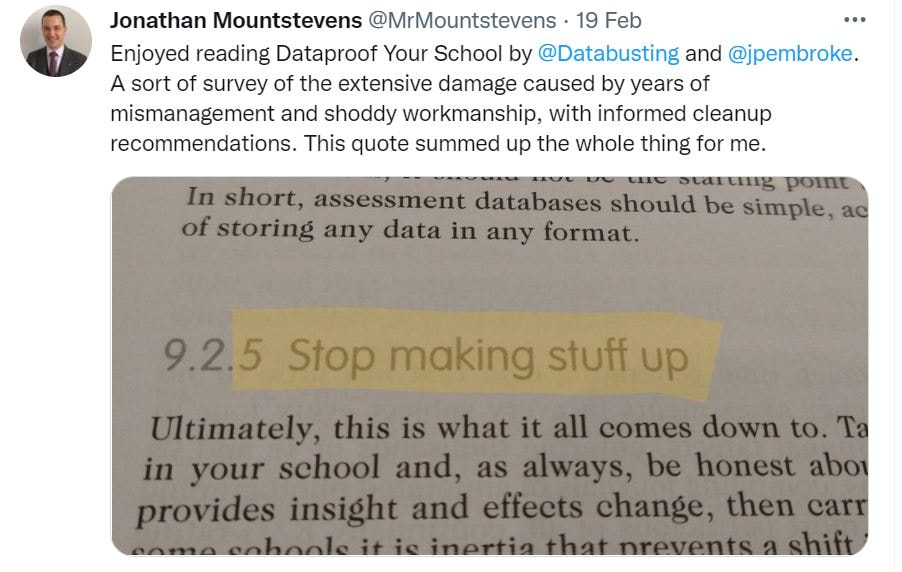  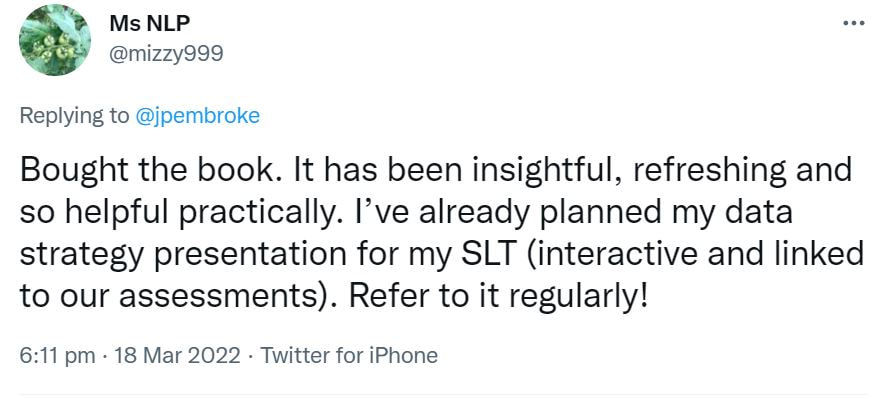  We discuss the book on the most recent Databusters Podcast, and here’s a outline of the chapters, which gives you a good sense of the book’s contents:
1 An Introduction to Using Data in School 2 A Licence to Change 3 Generating and Collating High-Quality Data 4 Standardised Tests 5 Teacher Assessment 6 Outliers 7 Tracking Systems 8 Developing a Data Strategy 9 Dataproofing in Action Amazon’s preview function gives you an opportunity to read the first few pages, and the book is available in all good book stores and online via Wordery, Waterstones and Sage Publications. We've been working remotely since March 23rd, when the UK went into lockdown due to Covid-19. Luckily, we have a book to write - Dataproof Your School, which is due to be published by Sage Publications in Spring 2021. Developed by Richard Selfridge and James Pembroke, we have been road-testing concepts throughout 2019-20, developing a clear guide to how to take control of your education data.
Two Databusters podcasts have been recorded during lockdown, What Just Happened? and Staying Alert. Join Richard and James as we mull over the latest issues in education data. Which many schools are working hard simply to keep ahead of the latest advice and regulations, there is clearly a huge opportunity within the current crisis; many schools are using this time to consider how they will develop their assessments systems for the time when all pupils are back in school, and Databusting for Schools are helping various organisations develop data strategies so that they are able to be confident that they are driving their data use rather than being driven by it. If you are interested in finding out what we could do for you, please get in touch. Launching The Databusters, crunching numbers on SEND and more data literacy
I’m extremely pleased to be able to announce that James Pembroke, data guru extraordinaire, and I have launch The Databusters – a new venture supporting teachers and schools in their drive to develop data literacy and to improve the use of data in the school system. James has unparalleled knowledge of all things statutory data and I bring my teaching experience and knowledge of testing and statistics; together we hope to keep on working on our joint mission to demystify and improve the use of data in the school system. We’re currently preparing a series of training events around the UK and have recently recorded and published the first in our new monthly podcasts: Databusters. Episode 1 looks at the revised Ofsted Education Inspection Framework, developments to the Inspection Data Summary Report and the first in our ‘What everyone needs to know about’ series, which looks as standardised scores. The podcast is currently available on Spotify and Anchor, and will be rolling out onto other platforms over the coming weeks. As part of my work with the Driver Youth Trust, this summer Karen Wespieser and I looked closely at SEND statistics and what these mean for the school system. We presented our findings at the Hallam Festival of Education, ResearchEd Rugby and the Festival of Education and I have contributed a chapter to the forthcoming researchED Guide to SEND. In November, I am in Manchester and Central London running sessions on Understanding and using standardised assessment and standardised scores to support teaching and learning for Rising Stars – places are booking up, so put it in your diary and I hope to see you there. If you'd like to know more about Databusting for Schools or The Databusters, please get in touch. A new book, crunching numbers on SEND and developing data literacy throughout Europe
Feedback from those who have read Databusting for Schools and those have attended sessions I have hosted since its publication has lead to the development of a new book for those who simply want to know what they should be doing with their data. Due in 2020, Dataproof Your School will provide answers to the pressing questions schools ask about collecting and using information. As part of my work with the Driver Youth Trust, I have been looking closely at SEND statistics and what these mean for the school system. I'll be presenting my findings alongside Karen Wespeiser at the Hallam Festival of Education, ResearchEd Rugby and the Festival of Education. In addition, I am pressenting my session on Assessment 101: 10 Things You Should Know About Assessing Children at ResearchEd Rugby, and I am part of a panel hosted by CEM at the Festival of Education, Measuring Progress in Education - The Good, the Bad and the Future. Looking into Autumn 2019, I am in Manchester and Central London running sessions on Understanding and using standardised assessment and standardised scores to support teaching and learning for Rising Stars, as part of a programme which includes training by Becky St John and James Pembroke. In the meantime, I am looking forward to the first international conference for Databusting for Schools, ResearchEd Haninge in March 2020. Databusting for Schools, Summer 2019: Hallam Festival of Education: 14 June ResearchEd Rugby 15 June Festival of Education 20 June and 21 June If you'd like to know more about Databusting for Schools, please get in touch.  I’m hugely exciting about the forthcoming Education Show, at ExCeL London on Thursday and Friday 24th and 25th January, where I’ll be chairing the Policy in Practice theatre, one of three different strands of the UK’s go-to annual education gathering. This is the first time I’m going to be able to attend BETT, too, the UK’s premier EdTech show, which this year runs alongside the Education Show.
In another first, the Education Show has moved to London for the first time in 28 years, and tickets – which are free to those working in education – are available here. Whilst I’m looking forward to hearing from the speakers I’m introducing – who include Laura McInerney, Drew Povey and Sherry Coutu – I’m also looking forward to the opportunity to see what is new and innovative from the show’s many exhibitors. There are two further strands in the Education Show’s programme of speakers, with both a School Business and a Pedagogy in Practice series of presentations. These strands include the incomparable Becky Allen, as well as award-winning teachers, researchers and those at the heart of education policy. Trade shows can often be overwhelming in my experience, and careful planning is the key to getting the most out them. Both the Education Show and Bett make that easy, of course, by including extensive details on their websites, which are up and running with all the details you might possibly need. One of the joys of education gatherings like the Education Shows is the opportunity to stumble across things of which you were previously blissfully unaware, and with the sheer number of speakers and exhibitors at ExCeL, I’m looking forward to discovering the delights in store. A New Year always brings thoughts for the future, and now is a great time to take the opportunity to explore the challenges and inspirations which the next year will bring; events such as the Education Show and Bett pack a huge amount into a short space of time, making them an extremely efficient way to take a fresh look at what you are currently doing, and to consider your next move… Register for your free tickets here, and I look forward to seeing you at the Education Show! Where and when: Hall S4, ExCeL London, London E16 1XL Thu 24th Jan, 10:00 - 18:00 Fri 25th Jan, 10:00 - 17:00 |
Richard SelfridgeA Primary Teacher who writes, discusses and talks about education data. Archives
July 2024
Categories |
 RSS Feed
